

CSV to Chart Service: Upload any CSV file to our CSV to Chart service and watch as we transform your data into engaging, interactive charts (pie, bar and line charts). This service is perfect for quick data visualizations and gaining insights from spreadsheets and data exports.
Text List to Chart Service: Have a list in a plain text format? No problem! Our Text List to Chart service can take your simple text lists and convert them into visually stunning charts. This service makes it effortless to understand patterns and trends within your data. With this tool, you can make data-driven decisions based on your text data.
List to Bubble Chart Service: It changes simple lists into bubble charts. A bubble chart helps to compare different data sets and see their relations.
Instant-Interactive Math Graph Generator: Simply enter any math formula and -x to x limits and instantly get downloadable graph chart. Math formula graph builder.
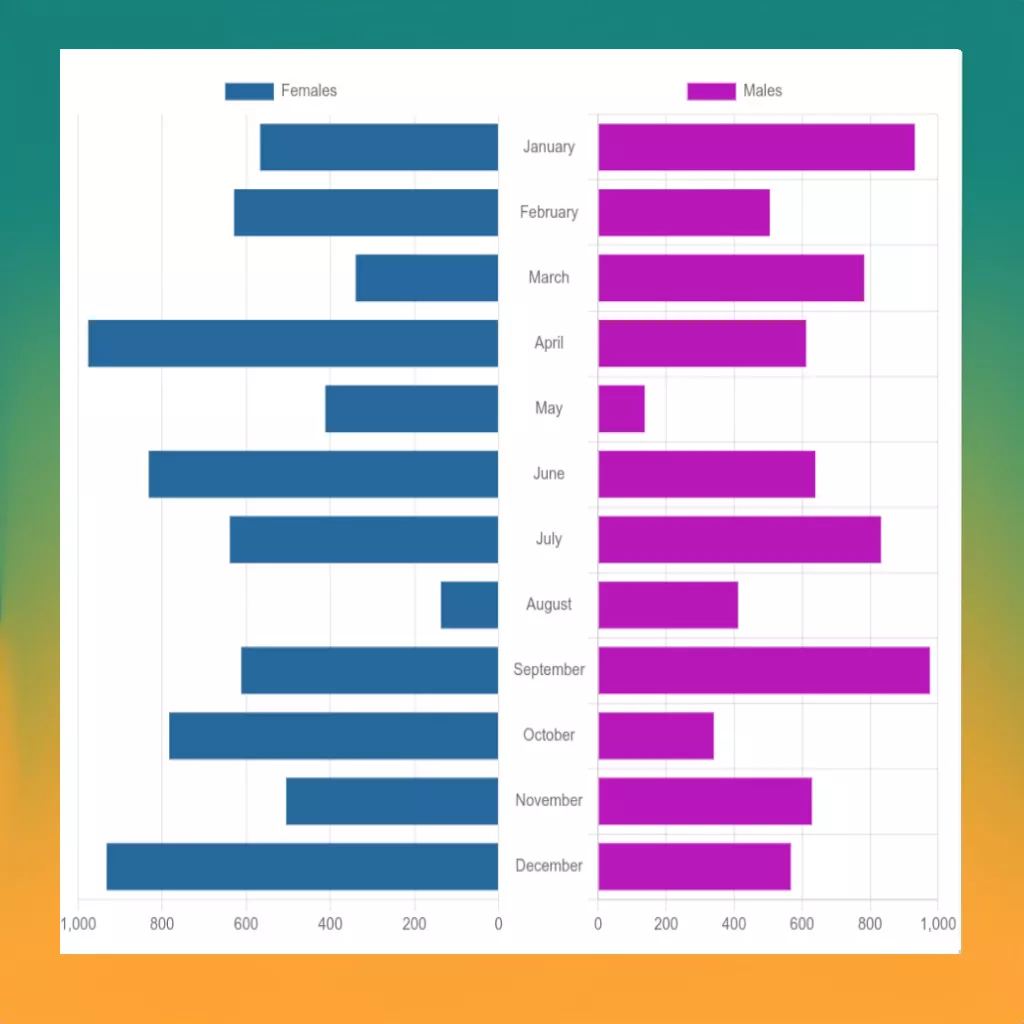
Side by Side Comparison Bar Chart Builder: Compare diverse datasets easily, make informed decisions, and engage your audience with striking, easy-to-understand visuals. Ideal for business, academic, or personal use.
Our Chart Generator services is good for data analysts, teaches, researchers, students, and anyone who needs a quick and efficient way to visualize their data and quickly download generated charts.
Currently we have 4 different builder services which cover the most basic needs on data->chart transformation.
But it doesn’t mean we will stop here – we are going to add some more advanced chart builders – the main goal is to make the process as simplest as possible, without using code, multiple steps etc. – just paste your data and get the chart ready.